
Genstat for Windows 23rd Edition UNLIMITED users
$ 160.00
Data Analysis Software
Genstat is flexible data analysis software that is easy to use for both technical and non-technical users in all fields of research.
Description
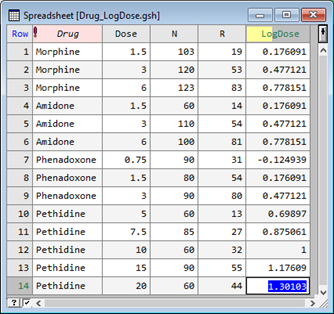
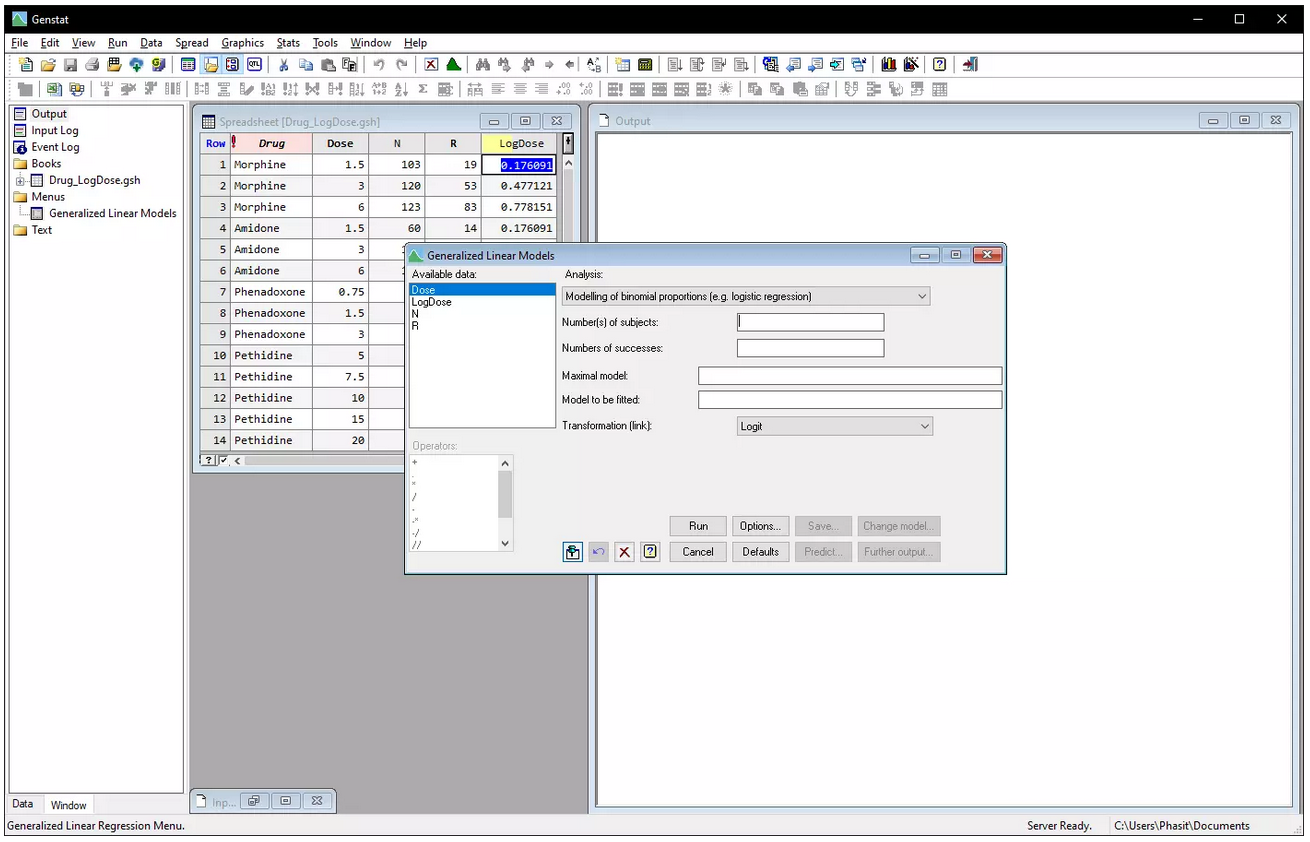
Modelling Binomial Proportions
Our data set compares the effectiveness of three analgesic drugs to a standard drug, morphine. Fourteen groups of mice were tested for response to the drugs at a range of doses. The variate N is the total number of mice in each group and R is the number that responded. LogDose is the logarithm (base 10) of the variate Dose. We are going to use logistic regression to model the relationship between the probability the mouse responded and our explanatory variables, the factor Drug, and the variate LogDose.
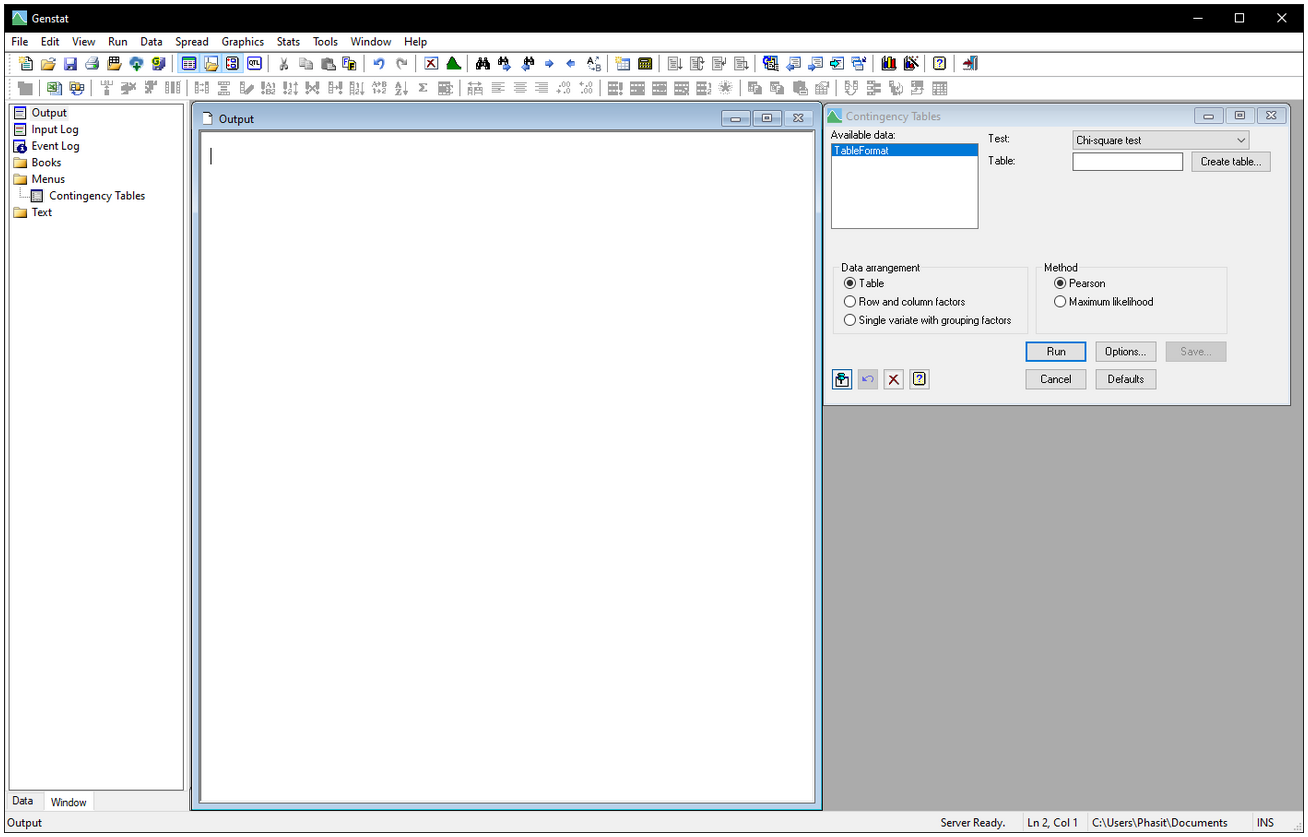
Contingency Tables
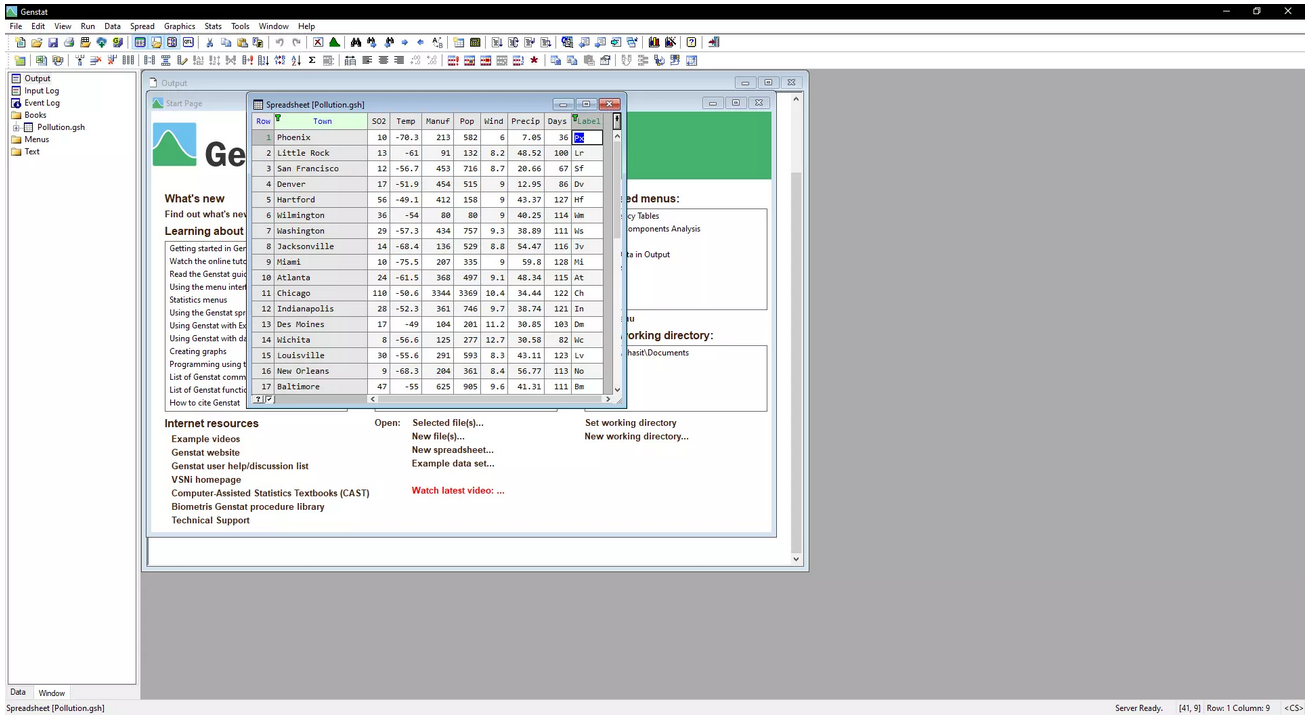
Let’s investigate the inter-relationships between variables associated with pollution and the towns these variables are measured on.
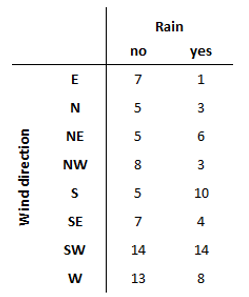
We’re going to perform a contingency table test to investigate the relationship between two categorical variables.
- Wind direction
- Whether or not it rained
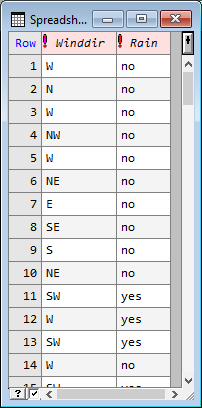
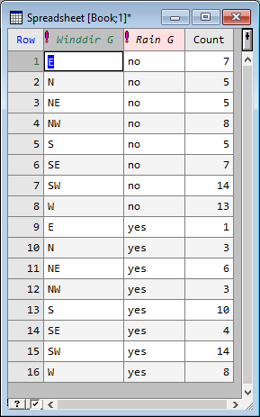
| Our data can be arranged in a table. | Or as a spreadsheet of categorical data. | Or as a spreadsheet containing a variate of counts with grouping factors. |
 |
 |
 |
Principal Components Analysis
The Principal Components Analysis demo is an interactive demo, pre-loaded with sample data to give you a real feel of using Genstat for your analysis.
Our data set contains measurements of 7 variables recorded in 41 towns in the USA.
|
|
Censored Poisson count data
Genstat makes it easy to analyse censored Poisson count data using a log-linear model, a generalized linear mixed model, or a hierarchical generalized linear model. Left and right censoring options are available on each of these menus, allowing you to set upper or lower values beyond which data will not be counted.
2D Trellis plot of groups
2D Trellis plots of groups are graphs that enable you to explore very large data sets in which observations are classified into groups. This graph type lets you investigate the distribution of groups of observations over two dimensions, that is, two variates, using either a trellis of bar charts or a trellis of pie charts.
Mosaic plots
Mosaic plots are a very powerful tool for visualising and exploring complex tables of counts, enabling you to identify patterns and relationships between multiple categorical variables in a single plot. Within the plot, each group (i.e., cell in the table) is represented by a coloured box, where the size of the box is proportional to the number of observations in that group.
PCA clustering
The aim of cluster analysis is to classify the observations into distinct groups based on how similar their data are. Genstat offers an efficient clustering algorithm specifically designed to handle very large multivariate data sets. This algorithm exploits principal components to reduce the dimensions of the data. Additionally, it uses a specialized clustering method to reduce the heavy computational load when dealing with a large number of observations.
Related products
-

Sescoi WorkNC 2016 with all add-ons
$ 150.00 Add to cart Quick View -
Sale!

Intergraph SmartPlant Electrical NEW cracked version
Original price was: $ 180.00.$ 135.00Current price is: $ 135.00. Add to cart Quick View -
Nikon CMM-Manager 3.5 cracked
$ 180.00 Add to cart Quick View -

Intergraph PV Elite V21 cracked version
$ 140.00 Add to cart Quick View -
Sale!

DESIGN SUITE cracked version
Original price was: $ 8,000.00.$ 250.00Current price is: $ 250.00. Add to cart Quick View -

NAPA 2013 Ship Design Software
$ 160.00 Add to cart Quick View -
Sale!

DRAWings 8 Pro cracked version
Original price was: $ 1,800.00.$ 140.00Current price is: $ 140.00. Add to cart Quick View -

Lantek Workshop (Manager, Wos, Capture)
$ 150.00 Add to cart Quick View -
GPR-SLICE v7.0 cracked radar software
$ 160.00 Add to cart Quick View -
Sale!

Intergraph Smart 3D 2016 cracked version
Original price was: $ 180.00.$ 135.00Current price is: $ 135.00. Add to cart Quick View